Being a geospatial professional is about embracing your passion. We ask: “how can I impact the world with spatial insights?”, and then build a career that supports that mission. Spatial Stack helps you grow your career both through skills but also practical insights to help you work better and do more.
What Geospatial Technology Got Right and Wrong During the 2025 LA Wildfire Season
Published about 1 year ago • 4 min read
In early 2025, Southern California endured yet another devastating wildfire season driven by the notorious Santa Ana winds. Fires ravaged Pacific Palisades and Altadena, burning thousands of acres, destroying local infrastructure, and displacing entire communities. This tragedy underscored the importance of geospatial technologies and remote sensing in disaster response and recovery.
The Role of Santa Ana Winds
Santa Ana winds are a defining characteristic of Southern California’s wildfire seasons. These winds originate from high-pressure systems over the Great Basin, where cold, dense air builds up. As the air moves toward the coast, it accelerates through mountain passes, compressing and warming in the process. This dynamic produces gusts of dry, hot wind capable of rapidly spreading wildfires and drying out vegetation to critical levels.
In January 2025, these winds reached speeds of over 60 mph, driving the flames across 14,000 acres in Altadena alone and consuming thousands of structures in Pacific Palisades. The low humidity levels, often below 10%, created the perfect conditions for rapid fire growth, leaving little time for residents and first responders to react effectively.
Source: Washington Post
Matt: I have been looking into wildfire models for some time now and there are two things that stand out to me. The first is that it is nearly impossible, or at best a fool’s errand to try and predict where a fire will start. We certainly know where there is a high amount of fire risk and the strong winds only added to that. But, as we have seen after the fact, there are many different ways these fires could have started and
Mapping Damage with Earth Observation Data
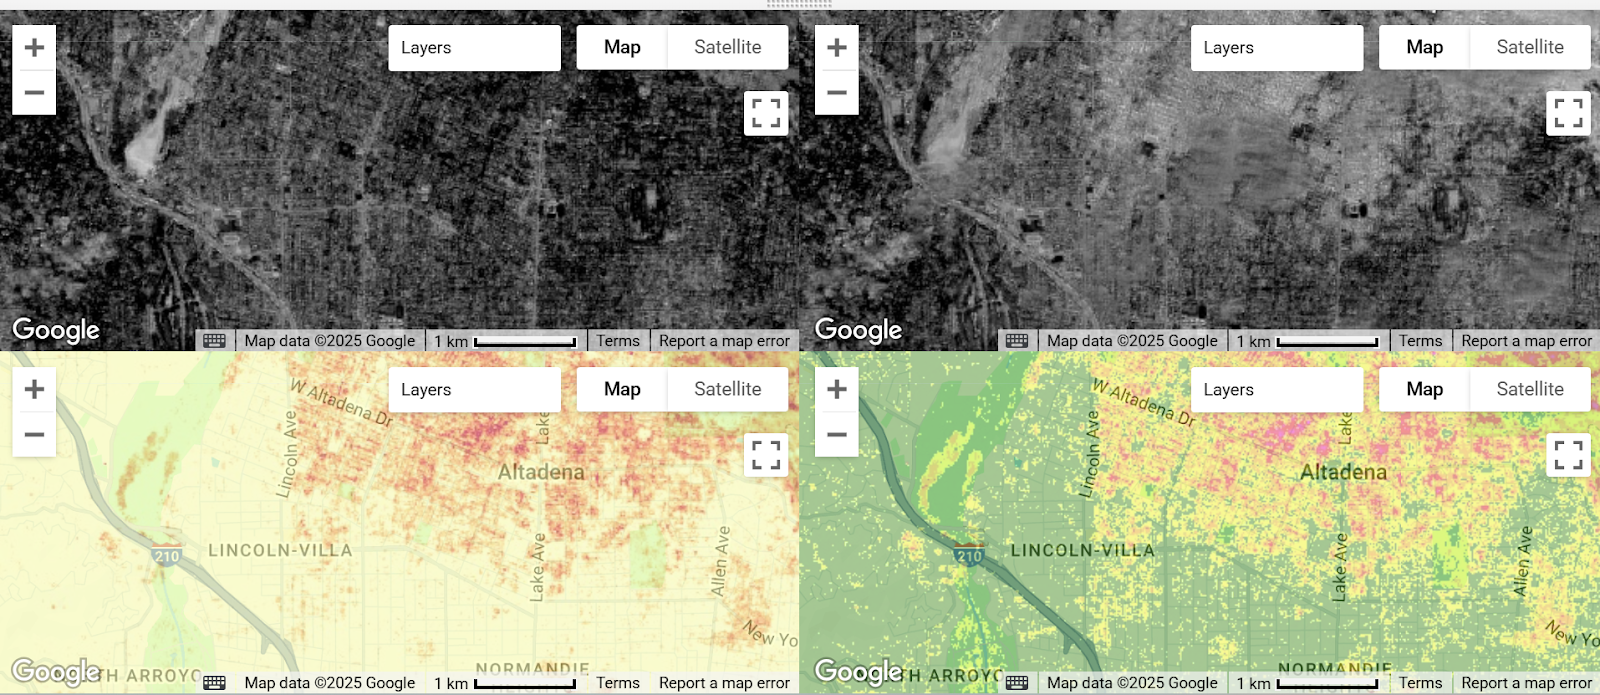
There’s no shortage of satellite constellations around earth, and more are getting launched into orbit each year, from both the government and private sectors. For the purposes of this article, we used free and publicly available Sentinel-2 imagery to calculate the Normalized Burn Ratio (NBR) both before and after the fires. The resulting Difference in Normalized Burn Ratio (dNBR) provided a burn severity map that revealed the extent of destruction, with over 41% of inspected structures in Altadena classified as destroyed. These maps allow users to explore the affected regions interactively via a Google Earth Engine script.
Normalized Burn Ratio (NBR) and Burn severity maps using Sentinel-2 Data in Google Earth Engine. Access it here
Geospatial tools like xBD and LARIAC have become indispensable in post-disaster analysis. The xBD dataset, with its 850,000 building polygons and detailed damage classifications, provides a foundation for understanding the granular impact of wildfires.
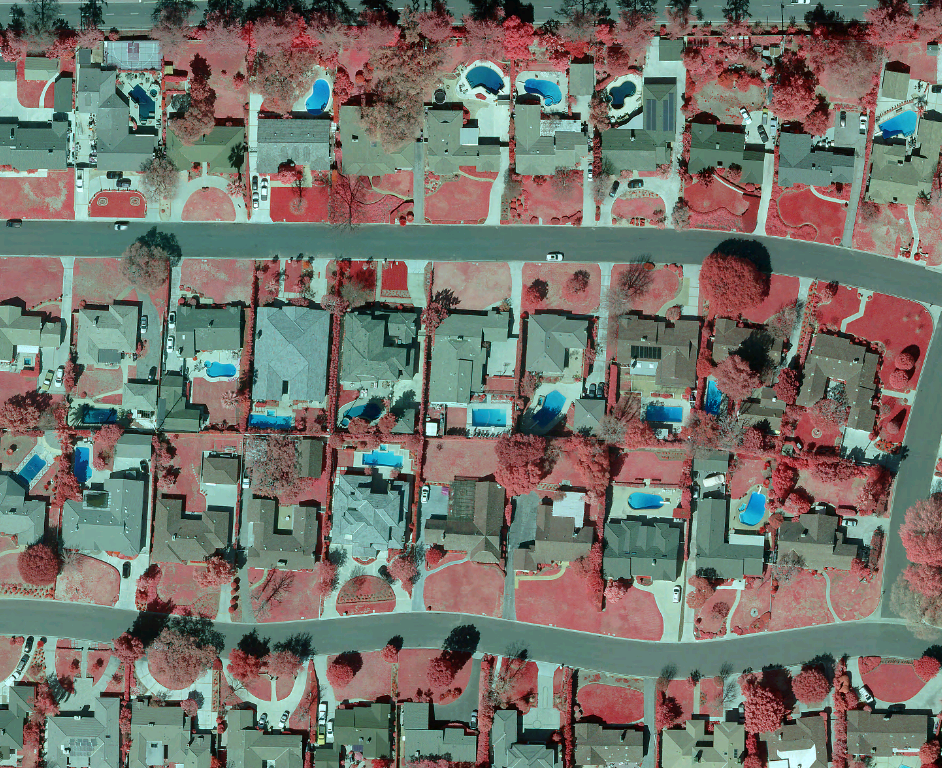
This resource is particularly valuable in mapping destruction at the building level, a critical step for recovery planning. LARIAC’s high-resolution aerial imagery and lidar data complement xBD by offering precise insights into structural and environmental impacts. LARIAC7’s imagery, captured at a resolution of 10 cm², enables detailed assessments of both homes and critical infrastructure like roads and hospitals.
High Resolution 2017 Infrared Image of Arcadia, CA. Source: LARIAC
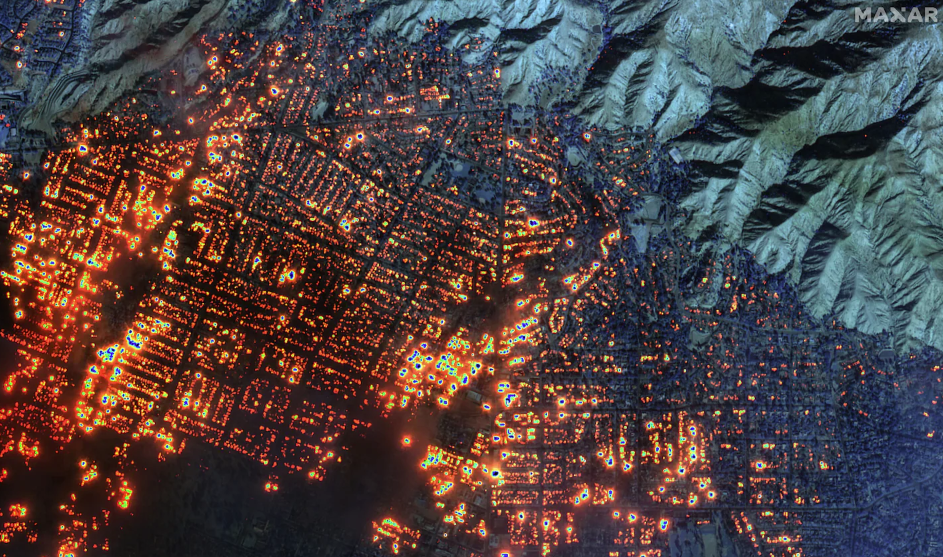
RomoGIS also contributed to communicating impacts from the fires in Pacific Palisades and Altadena. Using the California Open Data Portal’s Damage Inspection (DINS) database and Esri tools, RomoGIS created interactive apps that displayed survey data, including building damage ratings and images for both Pacific Palisades and Altadena . Microsoft’s AI for Good initiative also demonstrated the potential of artificial intelligence in disaster response.
By analyzing Maxar satellite imagery, their model assessed 156,102 structures, identifying 8,682 damaged buildings, including 7,026 with damage exceeding 50%. These rapid assessments, paired with traditional methods, provided a clearer picture of the fires’ impact and expedited recovery planning.
Matt: I met Frank Romo a few weeks ago at the geospatial risk summit and it was amazing to hear the inside track on all the work that went into building out that dashboard. I have to say he has a singular focus on creating usable tools that can be actually used by a wide range of individuals who may have never encountered a GIS platform before. I think this line of thinking will be critical to ensuring that tools can actually be used by citizens who are impacted regardless of the science behind it.
The data tells one story, but the lived experiences of those affected highlight the true scale of the tragedy. Erin Berbo, a resident of Altadena, described the harrowing moments as flames engulfed her home: "The whole experience lasted thirty seconds or so, but my life will be forever changed by it." She later learned her home was among the dozens destroyed, a loss shared by several Altadenian neighborhoods.
Brianna R. Pagán, PhD, recounted a different but equally poignant struggle. As a geospatial professional, she expected to have the tools and resources to act swiftly. Instead, she faced the same overwhelming confusion as others—sifting through fragmented data, delayed updates, and inconsistent information while trying to ensure her family’s safety. Brianna’s experience reflects a systemic issue in disaster response: even professionals with access to cutting-edge tools struggle to find critical, actionable information during emergencies.
As I researched this article, I encountered similar challenges. Data was dispersed across platforms, official updates lagged behind events on the ground, and local teams like Watch Duty became my primary source of real-time information. This struggle speaks to the broader need for cohesive, centralized data systems that prioritize accessibility and clarity during crises. Together, the stories of Erin, Brianna, and countless others underline the human cost of wildfires and the pressing need for innovation in disaster management.
Matt: This is one of the biggest insights that came out of these events. We have the tools and the data and the technology to be able to start to model and understand these fires and do so at a pretty frequent pace given the power of computing today. Yet we still have not done so. I'm not sure if that's necessarily anyone's fault, but I think the unfortunate truth that we have to realize is that these things will just keep happening. So now is the time to start to create technologies that get well ahead of these problems.
The Broader Implications of Wildfire Events
The fires of 2025 revealed both the immediate and long-term consequences of natural disasters. Environmentally, the loss of vegetation increases erosion risks and disrupts ecosystems. Airborne particulates from the fires degraded air quality, affecting over 900,000 individuals with prolonged exposure to hazardous conditions.
Economically, the damage strained public resources, with insurance claims projected to exceed $1.5 billion. Rebuilding efforts face challenges, including rising construction costs and labor shortages, which could delay recovery for years. Socially, the fires exacerbated existing inequities, as underserved communities struggled to access timely aid and resources.
These events also highlighted the importance of transparent and accessible data during emergencies. The success of initiatives like Microsoft’s AI for Good demonstrates the value of combining real-time data with community-focused tools. However, the gaps in centralized systems and the reliance on small, local teams underscore the need for industry-wide improvements in disaster response.
Join 2,531 readers of the Spatial Stack for tips, strategies, and resources to launch, grow, and your career in geospatial.
Being a geospatial professional is about embracing your passion. We ask: “how can I impact the world with spatial insights?”, and then build a career that supports that mission. Spatial Stack helps you grow your career both through skills but also practical insights to help you work better and do more.